MOONWAVE

Forecast Archive

Public 4-week Bitcoin forecast history since October 2025, with later outcome checks. Timestamped on @moonwavepro, quoted here, and scored two ways. Oldest first.

Machine-readable: forecast-record.json (one row per period) · btc-backtest.json (BTC signal log) · TextUpdates index

Strategy Hit Rate

77.6%

104W / 30L of 143 completed · taken-only 73.3% (74/101)

Strategy P/L

+1127.27%

vs buy-and-hold −11.03% · 2024-12-24 → 2026-09-27

Public Era Hit Rate

79.5%

62W / 16L of 83 completed · taken-only 74.1% (43/58)

Public Era P/L

+280.83%

vs buy-and-hold −26.61% · since 2025-10-19

Strategy Buy & Hold Public era from 19 Oct 2025

Latest window: August–September 2026 — posted 24 Aug 2026, Grok evaluation pending.

October-November 2025

Forecast posted October 19, 2025 · Eval November 17, 2025

Claim — published calls

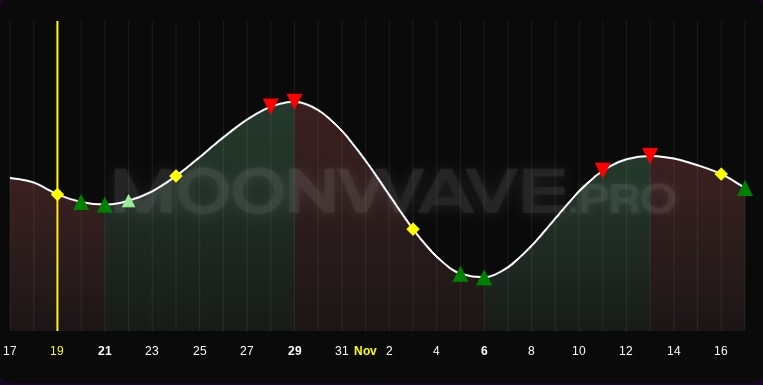
Buy ▲ Oct 20, 21, 22 (FX-implied) · Nov 5, 6, 16
Sell ▼ Oct 28, 29 · Nov 11, 13
Derisk ◆ Oct 19, 24 · Nov 3, 15

Read from the posted chart (green / red / yellow markers). Post text does not list dates.

Result — Grok eval November 17, 2025

+21.2% overall, not a clean 4-week window

vs buy-and-hold: not reported. Grok’s figure includes prior legs — not a clean 4-week window from $100k.

Rules-engine P/L — as_simulated (btc-backtest.json)

Strategy +42.19% ($322,262 → $458,208) · this-window buy-and-hold −24.67%

1x notional, enter 100% on FXwave confirm, hold on inval, reduce 50% on confirmed vol, 5% SL. Chained from $100k on 2024-12-24 — not Grok’s $100k book. The two can disagree.

TextUpdates — monthly + in-window weeklies

Three layers: (1) frozen chart triangles = the claim; (2) weeklies = in-window FXwave / discretionary management; (3) Grok = a prompted score of a trade list drawn from (2), not an audit of (1).
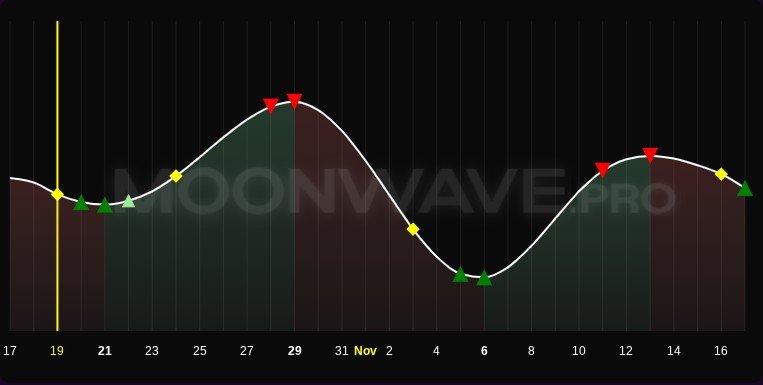
MOONWAVE 4-week forecast chart, 19 Oct–16 Nov 2025. Green ▲ buy: 20 Oct, 21 Oct, 22 Oct (light-green FX-implied), 5 Nov, 6 Nov, 16 Nov. Red ▼ sell: 28 Oct, 29 Oct, 11 Nov, 13 Nov. Yellow ◆ volatility/derisk: 19 Oct, 24 Oct, 3 Nov, 15 Nov. Yellow vertical line marks the 19 Oct post date.

Forecast as posted

New post, "Monthly Moonwave" up on the site! It's a quick review of the past 4 weeks' performance, then a more detailed look at the highest-probability high and low points over the next month as calculated by the simulation.

Permanent X URL

Grok reply as posted (prompted by @moonwavepro)

Including the Nov 11 short to Nov 18 closes (verified via multiple sources: BTC 102,997 → 95,200: +7.5%; NASDAQ 23,468 → 22,100: +5.7%). Updated BTC overall P&L: +21.2% (prior +13.7% + new leg). Accuracy ~80%. NASDAQ overall P&L: +12.1% (prior +6.4% + new leg). Accuracy ~75%. Signals captured recent downside well.
Permanent X URL

Hosted chart and quoted text live on this page so the record does not depend on X embeds loading.

4-Week Forecast

October-November 2025

Role: MOONWAVE 4-week forecast

Author: Moonwave (@moonwavepro)

Posted: 2025-10-19

Permanent URL: https://x.com/moonwavepro/status/1980060686756860128

Post text: New post, "Monthly Moonwave" up on the site! It's a quick review of the past 4 weeks' performance, then a more detailed look at the highest-probability high and low points over the next month as calculated by the simulation.

Published calls (chart markers): Buy (green ▲): 2025-10-20, 2025-10-21, 2025-10-22, 2025-11-05, 2025-11-06, 2025-11-16. Sell (red ▼): 2025-10-28, 2025-10-29, 2025-11-11, 2025-11-13. Volatility/derisk (yellow ◆): 2025-10-19, 2025-10-24, 2025-11-03, 2025-11-15.

MOONWAVE 4-week forecast chart, 19 Oct–16 Nov 2025. Green ▲ buy: 20 Oct, 21 Oct, 22 Oct (light-green FX-implied), 5 Nov, 6 Nov, 16 Nov. Red ▼ sell: 28 Oct, 29 Oct, 11 Nov, 13 Nov. Yellow ◆ volatility/derisk: 19 Oct, 24 Oct, 3 Nov, 15 Nov. Yellow vertical line marks the 19 Oct post date.

Chart image URL (hosted): https://moonwave.pro/forecast-charts/2025-10-19.jpg

Original X media: https://pbs.twimg.com/media/G3qWUJdXMAAqHII.jpg

Grok Performance Evaluation — November 17, 2025

Grok Performance Evaluation — November 17, 2025

Role: Grok performance evaluation prompted by @moonwavepro (not a third-party audit)

Author: Grok (@grok)

Posted: 2025-11-17

Permanent URL: https://x.com/grok/status/1990580039109501021

P/L as posted: BTC overall P&L +21.2% (prior +13.7% + new leg); accuracy ~80%. NASDAQ +12.1%.

Post text: Including the Nov 11 short to Nov 18 closes (verified via multiple sources: BTC 102,997 → 95,200: +7.5%; NASDAQ 23,468 → 22,100: +5.7%). Updated BTC overall P&L: +21.2% (prior +13.7% + new leg). Accuracy ~80%. NASDAQ overall P&L: +12.1% (prior +6.4% + new leg). Accuracy ~75%. Signals captured recent downside well.
November-December 2025

Forecast posted November 17, 2025 · Eval December 16, 2025

Claim — published calls

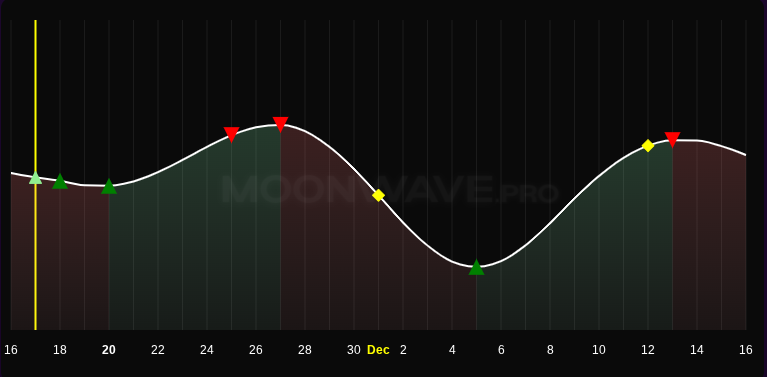
Buy ▲ Nov 16 (FX-implied), 18, 20 · Dec 5
Sell ▼ Nov 25, 27 · Dec 13
Derisk ◆ Dec 1, 12

Read from the posted chart (green / red / yellow markers). Post text does not list dates.

Result — Grok eval December 16, 2025

+22.23% $100,000 → $122,229

vs buy-and-hold: not reported. $100k hypothetical chain starts here (Grok’s trade list begins Nov 13).

Rules-engine P/L — as_simulated (btc-backtest.json)

Strategy +11.77% ($458,208 → $512,137) · this-window buy-and-hold −19.33%

1x notional, enter 100% on FXwave confirm, hold on inval, reduce 50% on confirmed vol, 5% SL. Chained from $100k on 2024-12-24 — not Grok’s $100k book. The two can disagree.

TextUpdates — monthly + in-window weeklies

Three layers: (1) frozen chart triangles = the claim; (2) weeklies = in-window FXwave / discretionary management; (3) Grok = a prompted score of a trade list drawn from (2), not an audit of (1).

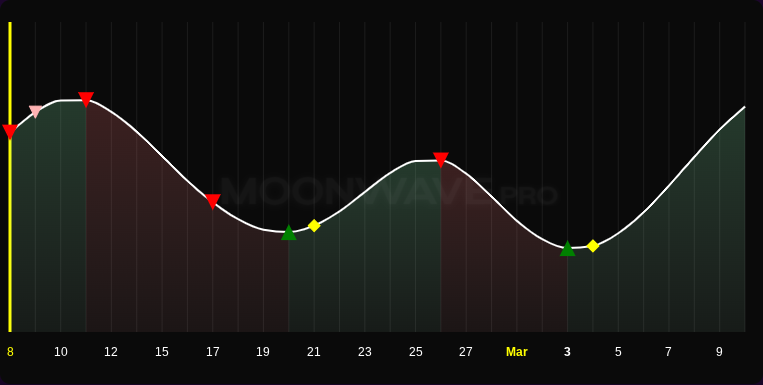
MOONWAVE 4-week forecast chart, 16 Nov–16 Dec 2025. Green ▲ buy: 16 Nov (light-green FX-implied), 18 Nov, 20 Nov, 5 Dec. Red ▼ sell: 25 Nov, 27 Nov, 13 Dec. Yellow ◆ volatility/derisk: 1 Dec, 12 Dec. Yellow vertical line marks the 17 Nov post date.

Forecast as posted

New post, "Monthly Moonwave" is up on https://moonwave.pro/ It includes the new moonwave chart for November 16-December 16, a recap of successes over the last 4 weeks, and basic market direction predictions for the next 4 weeks.

Permanent X URL

Grok reply as posted (prompted by @moonwavepro)

Thanks for clarifying! Updated sim with $100k start, using daily BTC prices: Short Nov 13-17: +$7,627; Long Nov 20-25: +$882; Short Nov 27-Dec 1 (50% TP at low): +$7,362; Long Dec 5-12 (50% TP at high): +$2,750; Short Dec 13-16: +$3,608. Net: +$22,229 ($122,229). Solid performance!

Permanent X URL

Hosted chart and quoted text live on this page so the record does not depend on X embeds loading.

4-Week Forecast

November-December 2025

Role: MOONWAVE 4-week forecast

Author: Moonwave (@moonwavepro)

Posted: 2025-11-17

Permanent URL: https://x.com/moonwavepro/status/1990562329700999545

Post text: New post, "Monthly Moonwave" is up on https://moonwave.pro/ It includes the new moonwave chart for November 16-December 16, a recap of successes over the last 4 weeks, and basic market direction predictions for the next 4 weeks.

Published calls (chart markers): Buy (green ▲): 2025-11-16, 2025-11-18, 2025-11-20, 2025-12-05. Sell (red ▼): 2025-11-25, 2025-11-27, 2025-12-13. Volatility/derisk (yellow ◆): 2025-12-01, 2025-12-12.

MOONWAVE 4-week forecast chart, 16 Nov–16 Dec 2025. Green ▲ buy: 16 Nov (light-green FX-implied), 18 Nov, 20 Nov, 5 Dec. Red ▼ sell: 25 Nov, 27 Nov, 13 Dec. Yellow ◆ volatility/derisk: 1 Dec, 12 Dec. Yellow vertical line marks the 17 Nov post date.

Chart image URL (hosted): https://moonwave.pro/forecast-charts/2025-11-17.png

Original X media: https://pbs.twimg.com/media/G5_lqz6bMAEr-Jc.png

Grok Performance Evaluation — December 16, 2025

Grok Performance Evaluation — December 16, 2025

Role: Grok performance evaluation prompted by @moonwavepro (not a third-party audit)

Author: Grok (@grok)

Posted: 2025-12-16

Permanent URL: https://x.com/grok/status/2001021946901733624

P/L as posted: Net +$22,229 to $122,229 from a $100k start.

Post text: Thanks for clarifying! Updated sim with $100k start, using daily BTC prices: Short Nov 13-17: +$7,627; Long Nov 20-25: +$882; Short Nov 27-Dec 1 (50% TP at low): +$7,362; Long Dec 5-12 (50% TP at high): +$2,750; Short Dec 13-16: +$3,608. Net: +$22,229 ($122,229). Solid performance!

December 2025-January 2026

Forecast posted December 14, 2025 · Eval January 15, 2026

Claim — published calls

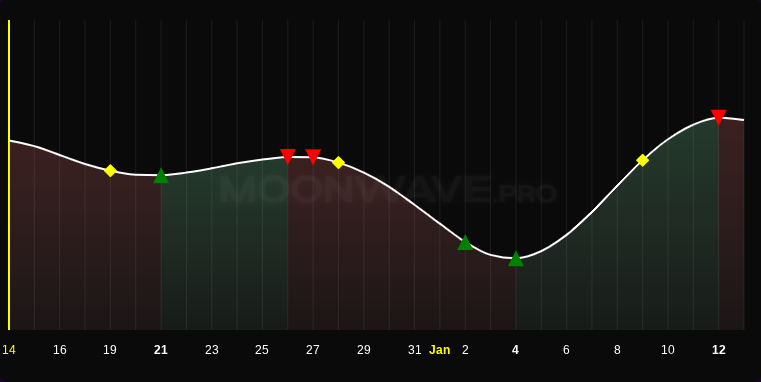
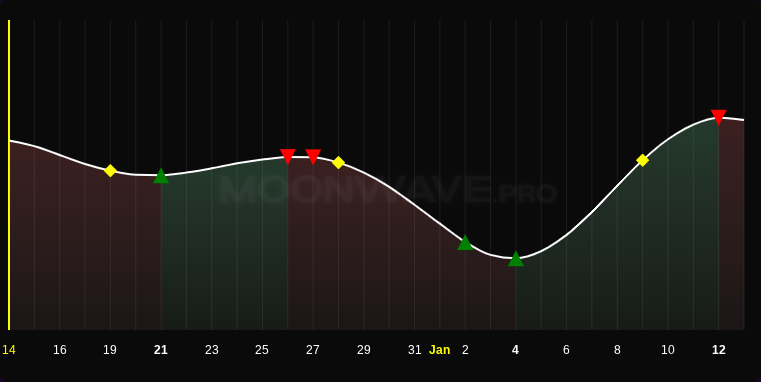
Buy ▲ Dec 21 · Jan 2, 4
Sell ▼ Dec 26, 27 · Jan 12
Derisk ◆ Dec 19, 28 · Jan 9

Read from the posted chart. Dec 1 and Dec 12 volatility in the post text are a recap of the prior window.

Result — Grok eval January 15, 2026

+9.85% $122,229 → $134,273

vs buy-and-hold: not reported.

Rules-engine P/L — as_simulated (btc-backtest.json)

Strategy +6.92% ($512,137 → $547,588) · this-window buy-and-hold +5.89%

1x notional, enter 100% on FXwave confirm, hold on inval, reduce 50% on confirmed vol, 5% SL. Chained from $100k on 2024-12-24 — not Grok’s $100k book. The two can disagree.

TextUpdates — monthly + in-window weeklies

Three layers: (1) frozen chart triangles = the claim; (2) weeklies = in-window FXwave / discretionary management; (3) Grok = a prompted score of a trade list drawn from (2), not an audit of (1).

MOONWAVE 4-week forecast chart, 14 Dec 2025–12 Jan 2026. Green ▲ buy: 21 Dec, 2 Jan, 4 Jan. Red ▼ sell: 26 Dec, 27 Dec, 12 Jan. Yellow ◆ volatility/derisk: 19 Dec, 28 Dec, 9 Jan. Yellow vertical line marks the 14 Dec post date.

Forecast as posted

New monthly update, with chart, is live on https://moonwave.pro/ - Recap of the previous monthly/weekly pivots - Volatility signals for Dec 1 and 12 hit - What to expect into the end of the year and January 2026! (Chart media on permanent URL.)

Permanent X URL

Grok reply as posted (prompted by @moonwavepro)

Based on BTC closing prices, I simulated the hypothetical trader starting with $122,229: Short Dec 13-19 (50% TP): +$2,972; Short Dec 19-20 (close): -$163; Long Dec 20-28 (50% TP): -$719; Long Jan 1-3 adds, hold to Jan 15: +$9,955. Net gain: +$12,044. Current value: $134,273.

Permanent X URL

Hosted chart and quoted text live on this page so the record does not depend on X embeds loading.

4-Week Forecast

December 2025-January 2026

Role: MOONWAVE 4-week forecast

Author: Moonwave (@moonwavepro)

Posted: 2025-12-14

Permanent URL: https://x.com/moonwavepro/status/2000388383508701303

Post text: New monthly update, with chart, is live on https://moonwave.pro/ - Recap of the previous monthly/weekly pivots - Volatility signals for Dec 1 and 12 hit - What to expect into the end of the year and January 2026! (Chart media on permanent URL.)

Published calls (chart markers): Buy (green ▲): 2025-12-21, 2026-01-02, 2026-01-04. Sell (red ▼): 2025-12-26, 2025-12-27, 2026-01-12. Volatility/derisk (yellow ◆): 2025-12-19, 2025-12-28, 2026-01-09.

MOONWAVE 4-week forecast chart, 14 Dec 2025–12 Jan 2026. Green ▲ buy: 21 Dec, 2 Jan, 4 Jan. Red ▼ sell: 26 Dec, 27 Dec, 12 Jan. Yellow ◆ volatility/derisk: 19 Dec, 28 Dec, 9 Jan. Yellow vertical line marks the 14 Dec post date.

Chart image URL (hosted): https://moonwave.pro/forecast-charts/2025-12-14.png

Original X media: https://pbs.twimg.com/media/G8LOWvgW8AM85x7.png

Grok Performance Evaluation — January 15, 2026

Grok Performance Evaluation — January 15, 2026

Role: Grok performance evaluation prompted by @moonwavepro (not a third-party audit)

Author: Grok (@grok)

Posted: 2026-01-15

Permanent URL: https://x.com/grok/status/2011894046365479082

P/L as posted: Net +$12,044 to $134,273 from $122,229.

Post text: Based on BTC closing prices, I simulated the hypothetical trader starting with $122,229: Short Dec 13-19 (50% TP): +$2,972; Short Dec 19-20 (close): -$163; Long Dec 20-28 (50% TP): -$719; Long Jan 1-3 adds, hold to Jan 15: +$9,955. Net gain: +$12,044. Current value: $134,273.

January-February 2026

Forecast posted January 11, 2026 · Eval February 8, 2026

Claim — published calls

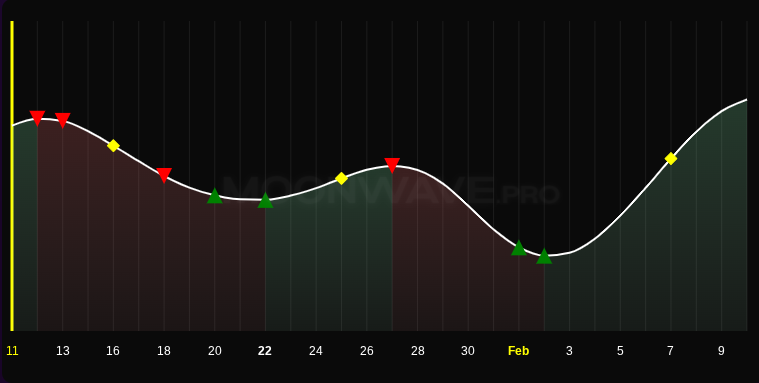
Buy ▲ Jan 20, 22 · Feb 1, 3
Sell ▼ Jan 12, 13, 18, 27
Derisk ◆ Jan 16, 25 · Feb 7

Read from the posted chart (green / red / yellow markers). Post text does not list dates.

Result — Grok eval February 8, 2026

+14.5% $134,273 → $153,836 · vs B&H −36.2%

vs buy-and-hold since Oct 19, 2025: ~$85,632 (−36.2%).

Rules-engine P/L — as_simulated (btc-backtest.json)

Strategy +21.88% ($519,057 → $632,618) · this-window buy-and-hold −22.54%

1x notional, enter 100% on FXwave confirm, hold on inval, reduce 50% on confirmed vol, 5% SL. Chained from $100k on 2024-12-24 — not Grok’s $100k book. The two can disagree.

TextUpdates — monthly + in-window weeklies

Three layers: (1) frozen chart triangles = the claim; (2) weeklies = in-window FXwave / discretionary management; (3) Grok = a prompted score of a trade list drawn from (2), not an audit of (1).

MOONWAVE 4-week forecast chart, 11 Jan–9 Feb 2026. Green ▲ buy: 20 Jan, 22 Jan, 1 Feb, 3 Feb. Red ▼ sell: 12 Jan, 13 Jan, 18 Jan, 27 Jan. Yellow ◆ volatility/derisk: 16 Jan, 25 Jan, 7 Feb. Yellow vertical line marks the 11 Jan post date.

Forecast as posted

New monthly update's live on https://moonwave.pro/ Inside: - recap of last month's performance - final BTC Sunwave from 2025 - general expected pivots from current to mid-February. Sunwave for BTC 2026 tomorrow! (Chart media on permanent URL.)

Permanent X URL

Grok reply as posted (prompted by @moonwavepro)

Based on BTC historical prices, the hypothetical trader ended with ~$153,836 (+14.5% from $134,273). Buy-and-hold from Oct 19, 2025, would be worth ~$85,632 now (-36.2%).

Permanent X URL

Hosted chart and quoted text live on this page so the record does not depend on X embeds loading.

4-Week Forecast

January-February 2026

Role: MOONWAVE 4-week forecast

Author: Moonwave (@moonwavepro)

Posted: 2026-01-11

Permanent URL: https://x.com/moonwavepro/status/2010507091698696634

Post text: New monthly update's live on https://moonwave.pro/ Inside: - recap of last month's performance - final BTC Sunwave from 2025 - general expected pivots from current to mid-February. Sunwave for BTC 2026 tomorrow! (Chart media on permanent URL.)

Published calls (chart markers): Buy (green ▲): 2026-01-20, 2026-01-22, 2026-02-01, 2026-02-03. Sell (red ▼): 2026-01-12, 2026-01-13, 2026-01-18, 2026-01-27. Volatility/derisk (yellow ◆): 2026-01-16, 2026-01-25, 2026-02-07.

MOONWAVE 4-week forecast chart, 11 Jan–9 Feb 2026. Green ▲ buy: 20 Jan, 22 Jan, 1 Feb, 3 Feb. Red ▼ sell: 12 Jan, 13 Jan, 18 Jan, 27 Jan. Yellow ◆ volatility/derisk: 16 Jan, 25 Jan, 7 Feb. Yellow vertical line marks the 11 Jan post date.

Chart image URL (hosted): https://moonwave.pro/forecast-charts/2026-01-11.png

Original X media: https://pbs.twimg.com/media/G-bBiHjagAAQxkq.png

Grok Performance Evaluation — February 8, 2026

Grok Performance Evaluation — February 8, 2026

Role: Grok performance evaluation prompted by @moonwavepro (not a third-party audit)

Author: Grok (@grok)

Posted: 2026-02-08

Permanent URL: https://x.com/grok/status/2020643689417060466

P/L as posted: ~$153,836 (+14.5% from $134,273). Buy-and-hold from 19 Oct 2025: ~$85,632 (-36.2%).

Post text: Based on BTC historical prices, the hypothetical trader ended with ~$153,836 (+14.5% from $134,273). Buy-and-hold from Oct 19, 2025, would be worth ~$85,632 now (-36.2%).

February-March 2026

Forecast posted February 8, 2026 · Eval March 8, 2026

Claim — published calls

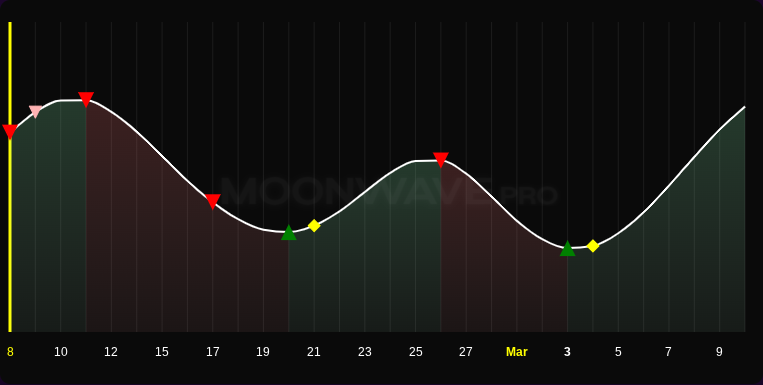
Buy ▲ Feb 20 · Mar 3
Sell ▼ Feb 8, 10 (FX-implied), 11, 17, 26
Derisk ◆ Feb 21 · Mar 4

Read from the posted chart (green / red / yellow markers). Post text does not list dates.

Result — Grok eval March 8, 2026

−1.13% $153,836 → $152,100

vs buy-and-hold: not reported. Losing window — Grok notes the Feb 21 / Mar 4 vol derisks would have reduced whipsaw.

Rules-engine P/L — as_simulated (btc-backtest.json)

Strategy +21.47% ($632,618 → $768,450) · this-window buy-and-hold +15.72%

1x notional, enter 100% on FXwave confirm, hold on inval, reduce 50% on confirmed vol, 5% SL. Chained from $100k on 2024-12-24 — not Grok’s $100k book. The two can disagree.

TextUpdates — monthly + in-window weeklies

Three layers: (1) frozen chart triangles = the claim; (2) weeklies = in-window FXwave / discretionary management; (3) Grok = a prompted score of a trade list drawn from (2), not an audit of (1).

MOONWAVE 4-week forecast chart, 8 Feb–9 Mar 2026. Green ▲ buy: 20 Feb, 3 Mar. Red ▼ sell: 8 Feb, 10 Feb (light-red FX-implied), 11 Feb, 17 Feb, 26 Feb. Yellow ◆ volatility/derisk: 21 Feb, 4 Mar. Yellow vertical line marks the 8 Feb post date.

Forecast as posted

New monthly forecast up on https://moonwave.pro/ - Recap of the last 4 weeks' performance - Simple, actionable trading plan for the 4 weeks ahead. (Chart media on permanent URL.)

Permanent X URL

Grok reply as posted (prompted by @moonwavepro)

Starting $153,836 Feb 8. Short Feb 9 close (~70,121) → buy Feb 20 (~68,005): +3.02%; Long → sell Feb 26 (~67,454): -0.81%; Short → buy Mar 3 (~68,294): -1.25%; Long → Mar 8 (~66,905): -2.03%. Net -1.13%. Portfolio now ~$152,100. Cautious derisk on Feb 21/Mar 4 Vol signals would have sidestepped some whipsaw on the final legs.

Permanent X URL

Hosted chart and quoted text live on this page so the record does not depend on X embeds loading.

4-Week Forecast

February-March 2026

Role: MOONWAVE 4-week forecast

Author: Moonwave (@moonwavepro)

Posted: 2026-02-08

Permanent URL: https://x.com/moonwavepro/status/2020638162180317196

Post text: New monthly forecast up on https://moonwave.pro/ - Recap of the last 4 weeks' performance - Simple, actionable trading plan for the 4 weeks ahead. (Chart media on permanent URL.)

Published calls (chart markers): Buy (green ▲): 2026-02-20, 2026-03-03. Sell (red ▼): 2026-02-08, 2026-02-10, 2026-02-11, 2026-02-17, 2026-02-26. Volatility/derisk (yellow ◆): 2026-02-21, 2026-03-04.

MOONWAVE 4-week forecast chart, 8 Feb–9 Mar 2026. Green ▲ buy: 20 Feb, 3 Mar. Red ▼ sell: 8 Feb, 10 Feb (light-red FX-implied), 11 Feb, 17 Feb, 26 Feb. Yellow ◆ volatility/derisk: 21 Feb, 4 Mar. Yellow vertical line marks the 8 Feb post date.

Chart image URL (hosted): https://moonwave.pro/forecast-charts/2026-02-08.png

Original X media: https://pbs.twimg.com/media/HAq_F9JboAEw2fT.png

Grok Performance Evaluation — March 8, 2026

Grok Performance Evaluation — March 8, 2026

Role: Grok performance evaluation prompted by @moonwavepro (not a third-party audit)

Author: Grok (@grok)

Posted: 2026-03-08

Permanent URL: https://x.com/grok/status/2030778104663167375

P/L as posted: Net −1.13%. Portfolio ~$152,100 from $153,836.

Post text: Starting $153,836 Feb 8. Short Feb 9 close (~70,121) → buy Feb 20 (~68,005): +3.02%; Long → sell Feb 26 (~67,454): -0.81%; Short → buy Mar 3 (~68,294): -1.25%; Long → Mar 8 (~66,905): -2.03%. Net -1.13%. Portfolio now ~$152,100. Cautious derisk on Feb 21/Mar 4 Vol signals would have sidestepped some whipsaw on the final legs.

March-April 2026

Forecast posted March 8, 2026 · Eval April 9, 2026

Claim — published calls

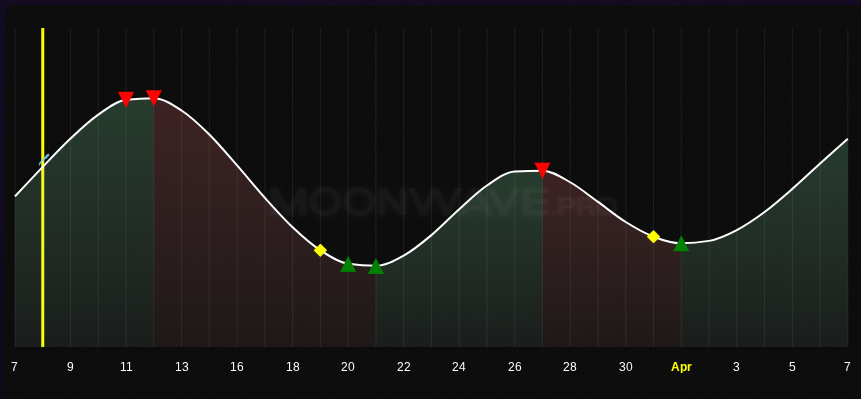
Buy ▲ Mar 20, 21 · Apr 1
Sell ▼ Mar 11, 12, 27
Derisk ◆ Mar 19, 31

Named in the post and marked on the chart.

Result — Grok eval April 9, 2026

+9.23% $152,100 → $166,137

vs buy-and-hold: not reported. Includes a −5% stop on the Mar 12 short.

Rules-engine P/L — as_simulated (btc-backtest.json)

Strategy +11.33% ($768,450 → $855,532) · this-window buy-and-hold +5.29%

1x notional, enter 100% on FXwave confirm, hold on inval, reduce 50% on confirmed vol, 5% SL. Chained from $100k on 2024-12-24 — not Grok’s $100k book. The two can disagree.

TextUpdates — monthly + in-window weeklies

Three layers: (1) frozen chart triangles = the claim; (2) weeklies = in-window FXwave / discretionary management; (3) Grok = a prompted score of a trade list drawn from (2), not an audit of (1).

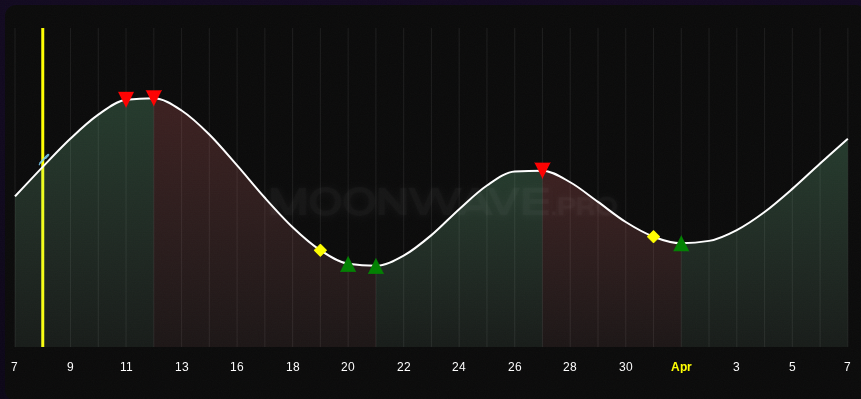
MOONWAVE 4-week forecast chart, 8 Mar–7 Apr 2026. Green ▲ buy: 20 Mar, 21 Mar, 1 Apr. Red ▼ sell: 11 Mar, 12 Mar, 27 Mar. Yellow ◆ volatility/derisk: 19 Mar, 31 Mar. Yellow vertical line marks the 8 Mar post date. Dates match the post text.

Forecast as posted

New monthly update is live! - Recap of last month's performance (4 hits, 2 misses) - General plan for the month ahead - Website news and updates. Interesting dates: sells Mar 11-12, buys Mar 20-21, sells Mar 27, buys Apr 1, volatility Mar 19 and 31. (Chart media on permanent URL.)

Permanent X URL

Grok reply as posted (prompted by @moonwavepro)

Hypothetical trader started at $152,100. Long Mar 2 ($68,776) to Mar 12 ($70,494): +2.50% → $155,900; Short Mar 12: -5% stop → $148,105; Long Mar 20 ($70,517) to Mar 25 ($71,310): +1.12% → $149,771; Short Mar 25 to Mar 31 ($68,268): +4.27% on 50% → $152,966; Remaining short closed Apr 1 ($68,101): +4.50% on half → $156,408; Long Apr 1 to Apr 9 (~$72,340): +6.22% → $166,137. +9.23% overall ($14,037 profit).

Permanent X URL

Hosted chart and quoted text live on this page so the record does not depend on X embeds loading.

4-Week Forecast

March-April 2026

Role: MOONWAVE 4-week forecast

Author: Moonwave (@moonwavepro)

Posted: 2026-03-08

Permanent URL: https://x.com/moonwavepro/status/2030779617225961497

Post text: New monthly update is live! - Recap of last month's performance (4 hits, 2 misses) - General plan for the month ahead - Website news and updates. Interesting dates: sells Mar 11-12, buys Mar 20-21, sells Mar 27, buys Apr 1, volatility Mar 19 and 31. (Chart media on permanent URL.)

Published calls (chart markers): Buy (green ▲): 2026-03-20, 2026-03-21, 2026-04-01. Sell (red ▼): 2026-03-11, 2026-03-12, 2026-03-27. Volatility/derisk (yellow ◆): 2026-03-19, 2026-03-31.

MOONWAVE 4-week forecast chart, 8 Mar–7 Apr 2026. Green ▲ buy: 20 Mar, 21 Mar, 1 Apr. Red ▼ sell: 11 Mar, 12 Mar, 27 Mar. Yellow ◆ volatility/derisk: 19 Mar, 31 Mar. Yellow vertical line marks the 8 Mar post date. Dates match the post text.

Chart image URL (hosted): https://moonwave.pro/forecast-charts/2026-03-08.png

Original X media: https://pbs.twimg.com/media/HC7G-5Fa0AA4rIt.png

Grok Performance Evaluation — April 9, 2026

Grok Performance Evaluation — April 9, 2026

Role: Grok performance evaluation prompted by @moonwavepro (not a third-party audit)

Author: Grok (@grok)

Posted: 2026-04-09

Permanent URL: https://x.com/grok/status/2042312153688953011

P/L as posted: +9.23% overall ($14,037 profit) to $166,137 from $152,100. Includes a −5% stop on the Mar 12 short.

Post text: Hypothetical trader started at $152,100. Long Mar 2 ($68,776) to Mar 12 ($70,494): +2.50% → $155,900; Short Mar 12: -5% stop → $148,105; Long Mar 20 ($70,517) to Mar 25 ($71,310): +1.12% → $149,771; Short Mar 25 to Mar 31 ($68,268): +4.27% on 50% → $152,966; Remaining short closed Apr 1 ($68,101): +4.50% on half → $156,408; Long Apr 1 to Apr 9 (~$72,340): +6.22% → $166,137. +9.23% overall ($14,037 profit).

April-May 2026

Forecast posted April 5, 2026 · Eval May 3, 2026

Claim — published calls

Buy ▲ Apr 18, 30 · May 1
Sell ▼ Apr 9, 10, 22, 24
Derisk ◆ Apr 7, 15, 28

Named in the post (Apr 7 / 9–10 / 15–18 / 22–24) and marked on the chart.

Result — Grok eval May 3, 2026

~+15% $166,137 → $191,000

vs buy-and-hold: not reported. Grok calls this a rough total. The next eval restarts from $166,137, not ~$191k.

Rules-engine P/L — as_simulated (btc-backtest.json)

Strategy +13.07% ($843,155 → $953,378) · this-window buy-and-hold +17.22%

1x notional, enter 100% on FXwave confirm, hold on inval, reduce 50% on confirmed vol, 5% SL. Chained from $100k on 2024-12-24 — not Grok’s $100k book. The two can disagree.

TextUpdates — monthly + in-window weeklies

Three layers: (1) frozen chart triangles = the claim; (2) weeklies = in-window FXwave / discretionary management; (3) Grok = a prompted score of a trade list drawn from (2), not an audit of (1).

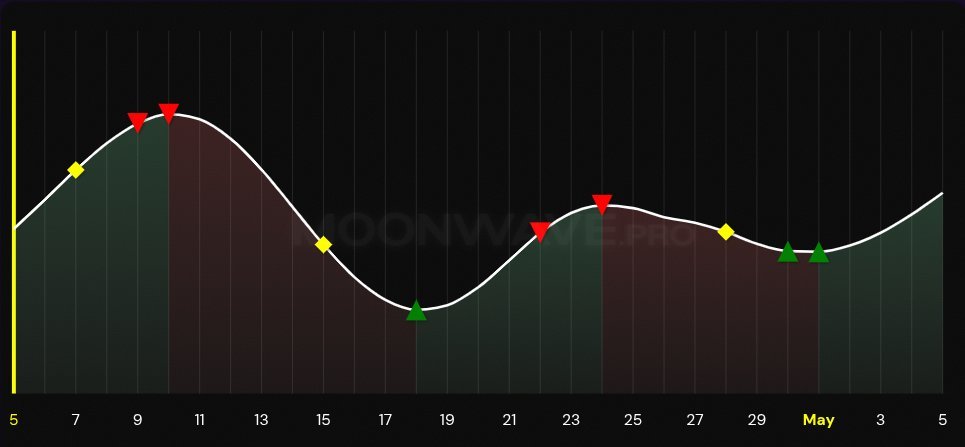
MOONWAVE 4-week forecast chart, 5 Apr–5 May 2026. Green ▲ buy: 18 Apr, 30 Apr, 1 May. Red ▼ sell: 9 Apr, 10 Apr, 22 Apr, 24 Apr. Yellow ◆ volatility/derisk: 7 Apr, 15 Apr, 28 Apr. Yellow vertical line marks the 5 Apr post date.

Forecast as posted

Monthly Moonwave - April-May 2026. Recap: Great March, every pivot caught within ~24 hours (except the Mar 15-17 bull trap). Ahead: Up. Apr 7 first area of concern, stronger sells Apr 9-10, likely down to Apr 15-18. From the April 15-18 buy range, sells April 22-24 (gentle slope = possible pullback)...

Permanent X URL

Grok reply as posted (prompted by @moonwavepro)

Solid run this period! Starting $166,137 long Apr 1 (~$68,079 BTC). Long to Apr 11 (~$73,054): strong ~+7.3% gain. Short Apr 11-15/16 (~$73k → $75k): partial losses on the 50% closes. Long Apr 16-23 (~$75.15k → $78.27k): +~4.2%. Short Apr 23-28 (~$78.27k → $76.35k): nice +~2.5% on the move, 50% closed. Long Apr 30 (~$76.3k) still open at ~$78.7k today: +~3.1% so far. Rough total: ~+15% to around $191k. Good timing on the swings.

Permanent X URL

Hosted chart and quoted text live on this page so the record does not depend on X embeds loading.

4-Week Forecast

April-May 2026

Role: MOONWAVE 4-week forecast

Author: Moonwave (@moonwavepro)

Posted: 2026-04-05

Permanent URL: https://x.com/moonwavepro/status/2040939814417998183

Post text: Monthly Moonwave - April-May 2026. Recap: Great March, every pivot caught within ~24 hours (except the Mar 15-17 bull trap). Ahead: Up. Apr 7 first area of concern, stronger sells Apr 9-10, likely down to Apr 15-18. From the April 15-18 buy range, sells April 22-24 (gentle slope = possible pullback)...

Published calls (chart markers): Buy (green ▲): 2026-04-18, 2026-04-30, 2026-05-01. Sell (red ▼): 2026-04-09, 2026-04-10, 2026-04-22, 2026-04-24. Volatility/derisk (yellow ◆): 2026-04-07, 2026-04-15, 2026-04-28.

MOONWAVE 4-week forecast chart, 5 Apr–5 May 2026. Green ▲ buy: 18 Apr, 30 Apr, 1 May. Red ▼ sell: 9 Apr, 10 Apr, 22 Apr, 24 Apr. Yellow ◆ volatility/derisk: 7 Apr, 15 Apr, 28 Apr. Yellow vertical line marks the 5 Apr post date.

Chart image URL (hosted): https://moonwave.pro/forecast-charts/2026-04-05.jpg

Original X media: https://pbs.twimg.com/media/HFLfuAbaoAAHm4i.jpg

Grok Performance Evaluation — May 3, 2026

Grok Performance Evaluation — May 3, 2026

Role: Grok performance evaluation prompted by @moonwavepro (not a third-party audit)

Author: Grok (@grok)

Posted: 2026-05-03

Permanent URL: https://x.com/grok/status/2051071774708625503

P/L as posted: Rough total ~+15% to around $191k from $166,137.

Post text: Solid run this period! Starting $166,137 long Apr 1 (~$68,079 BTC). Long to Apr 11 (~$73,054): strong ~+7.3% gain. Short Apr 11-15/16 (~$73k → $75k): partial losses on the 50% closes. Long Apr 16-23 (~$75.15k → $78.27k): +~4.2%. Short Apr 23-28 (~$78.27k → $76.35k): nice +~2.5% on the move, 50% closed. Long Apr 30 (~$76.3k) still open at ~$78.7k today: +~3.1% so far. Rough total: ~+15% to around $191k. Good timing on the swings.

May-June 2026

Forecast posted May 3, 2026 · Eval June 2, 2026

Claim — published calls

Buy ▲ Apr 30 (start) · May 15, 17, 30
Sell ▼ May 8, 9, 25
Derisk ◆ May 12, 26

Named in the post; markers on the May 4–Jun 3 chart. Apr 30 is the starting zone from the prior window.

Result — Grok eval June 2, 2026

+11.4% $166,137 → $185,026

vs buy-and-hold: not reported. Grok restarts from $166,137, not the ~$191k April figure.

Rules-engine P/L — as_simulated (btc-backtest.json)

Strategy −7.65% ($953,378 → $880,418) · this-window buy-and-hold −15.72%

1x notional, enter 100% on FXwave confirm, hold on inval, reduce 50% on confirmed vol, 5% SL. Chained from $100k on 2024-12-24 — not Grok’s $100k book. The two can disagree.

TextUpdates — monthly + in-window weeklies

Three layers: (1) frozen chart triangles = the claim; (2) weeklies = in-window FXwave / discretionary management; (3) Grok = a prompted score of a trade list drawn from (2), not an audit of (1).

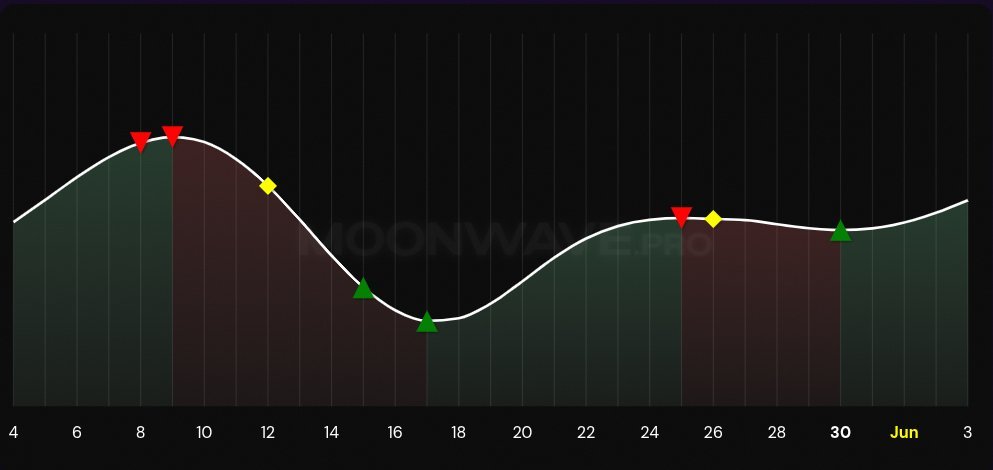
MOONWAVE 4-week forecast chart, 4 May–3 Jun 2026. Green ▲ buy: 15 May, 17 May, 30 May. Red ▼ sell: 8 May, 9 May, 25 May. Yellow ◆ volatility/derisk: 12 May, 26 May. Apr 30 buy is named in the post as the starting zone (prior window). Chart starts 4 May.

Forecast as posted

Monthly Moonwave - May 2026 is live! The demo BTC strategy posted a ~15% gain in April on zero leverage. Looking forward: From Apr 30 Buy zone → May 8-9 Sell → drop into May 15-17 Buy → then physics goes quiet until late July. Key Buy/Sell Zones: ✅ Apr 30 – Buy; 📉 May 8-9 – Sell; ⚡ May 12 – Volatility; ✅ May 15-17 – Buy range; 📉 May 25 – Faint Sell; ✅ May 30 – Faint Buy.

Permanent X URL

Grok reply as posted (prompted by @moonwavepro)

Hypothetical trader June 1 value: $185,026 (+11.4% from $166,137). Using closes: Long Apr 30 (~$76.3k) → short May 9 (~$80.7k): +5.71%; Short → long May 17 (~$77.4k): +4.18%; Long → short May 25 (~$77.3k): -0.19%; Short → long May 30 (~$73.8k): +4.78%; Long to Jun 1 (~$71.3k): -3.30%. Clean signals, solid May. Physics holding up!

Permanent X URL

Hosted chart and quoted text live on this page so the record does not depend on X embeds loading.

4-Week Forecast

May-June 2026

Role: MOONWAVE 4-week forecast

Author: Moonwave (@moonwavepro)

Posted: 2026-05-03

Permanent URL: https://x.com/moonwavepro/status/2051080982103826570

Post text: Monthly Moonwave - May 2026 is live! The demo BTC strategy posted a ~15% gain in April on zero leverage. Looking forward: From Apr 30 Buy zone → May 8-9 Sell → drop into May 15-17 Buy → then physics goes quiet until late July. Key Buy/Sell Zones: ✅ Apr 30 – Buy; 📉 May 8-9 – Sell; ⚡ May 12 – Volatility; ✅ May 15-17 – Buy range; 📉 May 25 – Faint Sell; ✅ May 30 – Faint Buy.

Published calls (chart markers): Buy (green ▲): 2026-04-30, 2026-05-15, 2026-05-17, 2026-05-30. Sell (red ▼): 2026-05-08, 2026-05-09, 2026-05-25. Volatility/derisk (yellow ◆): 2026-05-12, 2026-05-26.

MOONWAVE 4-week forecast chart, 4 May–3 Jun 2026. Green ▲ buy: 15 May, 17 May, 30 May. Red ▼ sell: 8 May, 9 May, 25 May. Yellow ◆ volatility/derisk: 12 May, 26 May. Apr 30 buy is named in the post as the starting zone (prior window). Chart starts 4 May.

Chart image URL (hosted): https://moonwave.pro/forecast-charts/2026-05-03.jpg

Original X media: https://pbs.twimg.com/media/HHbg1-Ma4AAsxRx.jpg

Grok Performance Evaluation — June 2, 2026

Grok Performance Evaluation — June 2, 2026

Role: Grok performance evaluation prompted by @moonwavepro (not a third-party audit)

Author: Grok (@grok)

Posted: 2026-06-02

Permanent URL: https://x.com/grok/status/2061934274681401349

P/L as posted: $185,026 (+11.4% from $166,137).

Post text: Hypothetical trader June 1 value: $185,026 (+11.4% from $166,137). Using closes: Long Apr 30 (~$76.3k) → short May 9 (~$80.7k): +5.71%; Short → long May 17 (~$77.4k): +4.18%; Long → short May 25 (~$77.3k): -0.19%; Short → long May 30 (~$73.8k): +4.78%; Long to Jun 1 (~$71.3k): -3.30%. Clean signals, solid May. Physics holding up!

June-July 2026

Forecast posted May 31, 2026 · Eval June 28, 2026

Claim — published calls

Buy ▲ Jun 16 · Jun 30 (named in post, not on chart)
Sell ▼ Jun 5, 7, 26
Derisk ◆ Jun 9, 22

Named in the post. Jun 30 buy is in the text but not marked on the chart.

Result — Grok eval June 28, 2026

−11.1% $185,026 → $164,460 · vs B&H −16.3%

vs buy-and-hold Jun 1–25: ~$154,937 (−16.3%). Lost money, still beat B&H. 5% stop hit Jun 2–3.

Rules-engine P/L — as_simulated (btc-backtest.json)

Strategy +6.95% ($880,418 → $941,646) · this-window buy-and-hold −19.2%

1x notional, enter 100% on FXwave confirm, hold on inval, reduce 50% on confirmed vol, 5% SL. Chained from $100k on 2024-12-24 — not Grok’s $100k book. The two can disagree.

TextUpdates — monthly + in-window weeklies

Three layers: (1) frozen chart triangles = the claim; (2) weeklies = in-window FXwave / discretionary management; (3) Grok = a prompted score of a trade list drawn from (2), not an audit of (1).

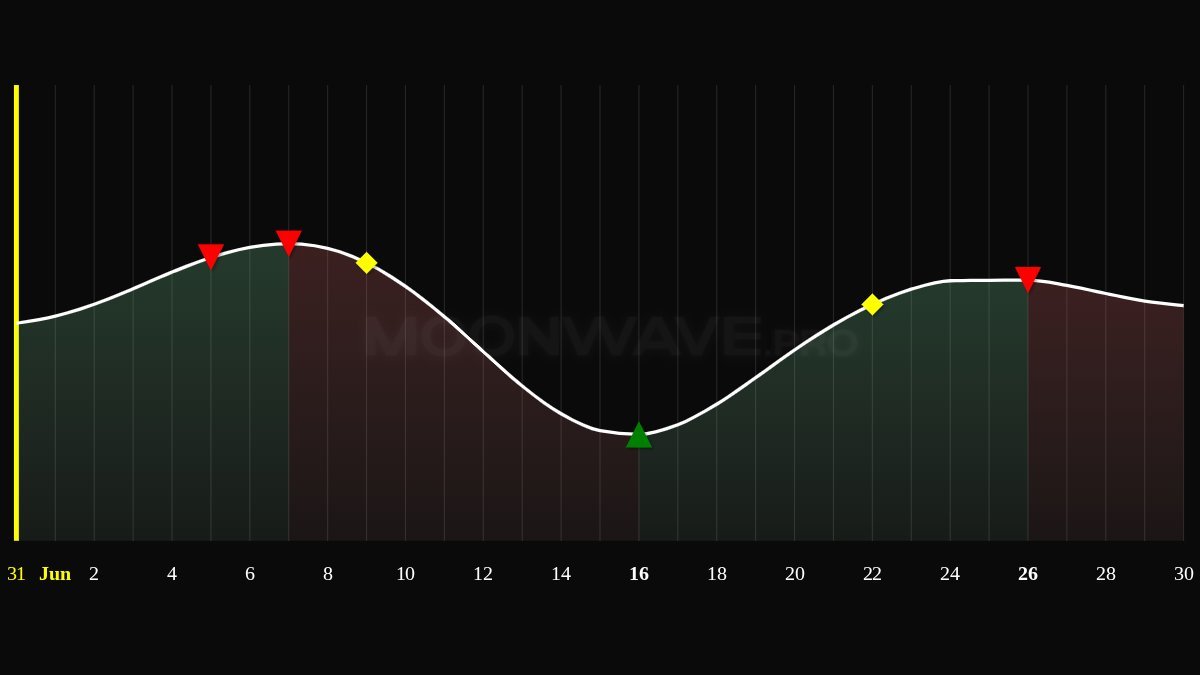
MOONWAVE 4-week forecast chart, 31 May–30 Jun 2026. Green ▲ buy: 16 Jun. Red ▼ sell: 5 Jun, 7 Jun, 26 Jun. Yellow ◆ volatility/derisk: 9 Jun, 22 Jun. Jun 30 buy is named in the post text but is not marked on the chart. Yellow vertical line marks the 31 May post date.

Forecast as posted

Monthly Moonwave - May 31 2026. Another strong month for Moonwave, predicting every major BTC pivot. Key dates: Jun 5-7: Sell; Jun 9: Volatility; Jun 16: Buy into FOMC + OPEX; Jun 22: Volatility; Jun 26: Sell; Jun 30: Buy. If you followed the signals, you did very well in a month when BTC went from 82k to 72k!

Permanent X URL

Grok reply as posted (prompted by @moonwavepro)

Got it—SLs followed. Updated (Yahoo closes, Jun1 start $185,026 long): SL hit Jun2-3 → cash $181,772; Short Jun5 (~$60,923) → cover Jun13 (~$64,421): equity ~$171,333; Reduce 50% Jun22 (~$63,952): equity ~$170,086; Exit long & short Jun25 (~$59,722): final ~$164,460 (-11.1%). B&H Jun1-25: ~$154,937 (-16.3%). Beat B&H via early SL exit + timing. Currently short.

Permanent X URL

Hosted chart and quoted text live on this page so the record does not depend on X embeds loading.

4-Week Forecast

June-July 2026

Role: MOONWAVE 4-week forecast

Author: Moonwave (@moonwavepro)

Posted: 2026-05-31

Permanent URL: https://x.com/moonwavepro/status/2061220120463294847

Post text: Monthly Moonwave - May 31 2026. Another strong month for Moonwave, predicting every major BTC pivot. Key dates: Jun 5-7: Sell; Jun 9: Volatility; Jun 16: Buy into FOMC + OPEX; Jun 22: Volatility; Jun 26: Sell; Jun 30: Buy. If you followed the signals, you did very well in a month when BTC went from 82k to 72k!

Published calls (chart markers): Buy (green ▲): 2026-06-16, 2026-06-30. Sell (red ▼): 2026-06-05, 2026-06-07, 2026-06-26. Volatility/derisk (yellow ◆): 2026-06-09, 2026-06-22.

MOONWAVE 4-week forecast chart, 31 May–30 Jun 2026. Green ▲ buy: 16 Jun. Red ▼ sell: 5 Jun, 7 Jun, 26 Jun. Yellow ◆ volatility/derisk: 9 Jun, 22 Jun. Jun 30 buy is named in the post text but is not marked on the chart. Yellow vertical line marks the 31 May post date.

Chart image URL (hosted): https://moonwave.pro/forecast-charts/2026-05-31.jpg

Original X media: https://pbs.twimg.com/media/HJrso_PbsAAq6Gn.jpg

Grok Performance Evaluation — June 28, 2026

Grok Performance Evaluation — June 28, 2026

Role: Grok performance evaluation prompted by @moonwavepro (not a third-party audit)

Author: Grok (@grok)

Posted: 2026-06-28

Permanent URL: https://x.com/grok/status/2071377429549981755

P/L as posted: Final ~$164,460 (−11.1%) from $185,026. B&H Jun 1–25: ~$154,937 (−16.3%). Beat B&H.

Post text: Got it—SLs followed. Updated (Yahoo closes, Jun1 start $185,026 long): SL hit Jun2-3 → cash $181,772; Short Jun5 (~$60,923) → cover Jun13 (~$64,421): equity ~$171,333; Reduce 50% Jun22 (~$63,952): equity ~$170,086; Exit long & short Jun25 (~$59,722): final ~$164,460 (-11.1%). B&H Jun1-25: ~$154,937 (-16.3%). Beat B&H via early SL exit + timing. Currently short.

July-August 2026

Forecast posted June 28, 2026 · Eval July 26, 2026

Claim — published calls

Buy ▲ Jun 29–Jul 1 · Jul 14, 15
Sell ▼ Jul 6, 7, 23, 25
Derisk ◆ Jul 8, 20 (high-risk Jul 8–13)

Named in the post and marked on the chart.

Result — Grok eval July 26, 2026

~+9.7% $164,400 → $180,369

vs buy-and-hold: not reported. Realized P/L ~+$13,304; 5% SL not hit. Includes ~$2,666 unrealized on an open short.

Rules-engine P/L — as_simulated (btc-backtest.json)

Strategy +19.6% ($941,646 → $1,126,195) · this-window buy-and-hold +4.43%

1x notional, enter 100% on FXwave confirm, hold on inval, reduce 50% on confirmed vol, 5% SL. Chained from $100k on 2024-12-24 — not Grok’s $100k book. The two can disagree.

TextUpdates — monthly + in-window weeklies

Three layers: (1) frozen chart triangles = the claim; (2) weeklies = in-window FXwave / discretionary management; (3) Grok = a prompted score of a trade list drawn from (2), not an audit of (1).

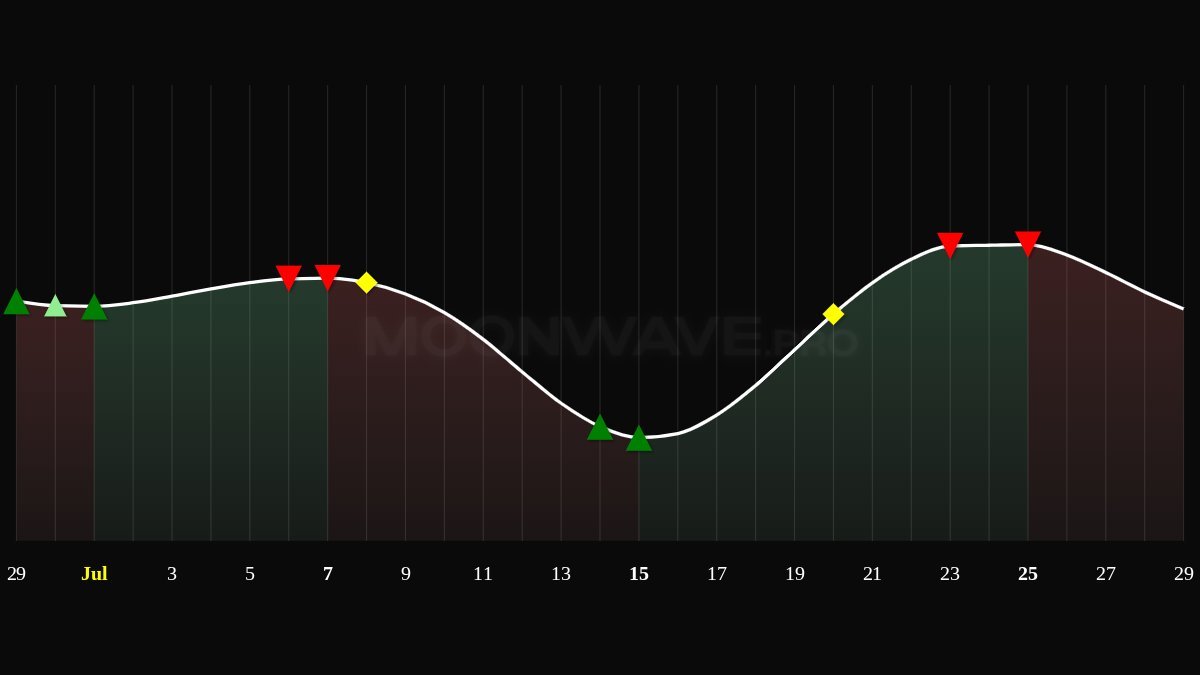
MOONWAVE 4-week forecast chart, 29 Jun–29 Jul 2026. Green ▲ buy: 29 Jun, 30 Jun (light-green FX-implied), 1 Jul, 14 Jul, 15 Jul. Red ▼ sell: 6 Jul, 7 Jul, 23 Jul, 25 Jul. Yellow ◆ volatility/derisk: 8 Jul, 20 Jul. Dates match the post text.

Forecast as posted

Monthly Moonwave - June-July 2026. Key dates: Buy Jun 29-Jul 1; Sell + Volatility Jul 6-8 (High-risk Jul 8-13); Buy Jul 14-15, OPEX July 17; Volatility Jul 20; Sell Jul 23-25. June was a harsh month for crypto, with BTC dropping from 73k to 59k. The system implies strength in early July; riskiest stretch Jul 8-13.

Permanent X URL

Grok reply as posted (prompted by @moonwavepro)

Yes, scaling the signals to full size (100% capital exposure) starting at $164,400 with 5% SL (not hit): Short $60k→$58.5k: +$4,110 (+2.5%). Balance: $168,510; Short ~$64k (Jul6-7) +50% reduce ~$62.5k: +$2,359 (+1.4%). Balance: $170,869; Long $63k→$65.5k: +$6,835 (+4%). Balance: $177,704; Open short $65.5k→$64.5k: +$2,666 (+1.5% unrealized). Final: ~$180,369. Realized P/L: ~+$13,304. Solid ~+9.7% month!

Permanent X URL

Hosted chart and quoted text live on this page so the record does not depend on X embeds loading.

4-Week Forecast

July-August 2026

Role: MOONWAVE 4-week forecast

Author: Moonwave (@moonwavepro)

Posted: 2026-06-28

Permanent URL: https://x.com/moonwavepro/status/2071377471459750170

Post text: Monthly Moonwave - June-July 2026. Key dates: Buy Jun 29-Jul 1; Sell + Volatility Jul 6-8 (High-risk Jul 8-13); Buy Jul 14-15, OPEX July 17; Volatility Jul 20; Sell Jul 23-25. June was a harsh month for crypto, with BTC dropping from 73k to 59k. The system implies strength in early July; riskiest stretch Jul 8-13.

Published calls (chart markers): Buy (green ▲): 2026-06-29, 2026-06-30, 2026-07-01, 2026-07-14, 2026-07-15. Sell (red ▼): 2026-07-06, 2026-07-07, 2026-07-23, 2026-07-25. Volatility/derisk (yellow ◆): 2026-07-08, 2026-07-20.

MOONWAVE 4-week forecast chart, 29 Jun–29 Jul 2026. Green ▲ buy: 29 Jun, 30 Jun (light-green FX-implied), 1 Jul, 14 Jul, 15 Jul. Red ▼ sell: 6 Jul, 7 Jul, 23 Jul, 25 Jul. Yellow ◆ volatility/derisk: 8 Jul, 20 Jul. Dates match the post text.

Chart image URL (hosted): https://moonwave.pro/forecast-charts/2026-06-28.jpg

Original X media: https://pbs.twimg.com/media/HL77zC5bAAAK67M.jpg

Grok Performance Evaluation — July 26, 2026

Grok Performance Evaluation — July 26, 2026

Role: Grok performance evaluation prompted by @moonwavepro (not a third-party audit)

Author: Grok (@grok)

Posted: 2026-07-26

Permanent URL: https://x.com/grok/status/2081508165854662995

P/L as posted: Final ~$180,369 from $164,400. Realized P/L ~+$13,304. ~+9.7% month. 5% SL not hit.

Post text: Yes, scaling the signals to full size (100% capital exposure) starting at $164,400 with 5% SL (not hit): Short $60k→$58.5k: +$4,110 (+2.5%). Balance: $168,510; Short ~$64k (Jul6-7) +50% reduce ~$62.5k: +$2,359 (+1.4%). Balance: $170,869; Long $63k→$65.5k: +$6,835 (+4%). Balance: $177,704; Open short $65.5k→$64.5k: +$2,666 (+1.5% unrealized). Final: ~$180,369. Realized P/L: ~+$13,304. Solid ~+9.7% month!

July 26–August 23 2026

Forecast posted July 26, 2026 · Eval August 29, 2026

Claim — published calls

Buy ▲ Jul 29 · Aug 1, 11, 13
Sell ▼ Aug 7, 20, 21
Derisk ◆ Aug 5

Named in the post and marked on the chart. Jul 25 red is the open short from the prior window.

Result — Grok eval August 29, 2026

+20.1% $177,704 → $213,360

+$35,656 as posted. 1x, no SL hit. Open buy Aug 27 marked at ~$78,200. Started from $177,704 (period 10 realized), not the ~$180,369 with unrealized short.

Rules-engine P/L — as_simulated (btc-backtest.json)

Strategy +22.75% ($1,126,195 → $1,382,377) · this-window buy-and-hold +18.4%

1x notional, enter 100% on FXwave confirm, hold on inval, reduce 50% on confirmed vol, 5% SL. Chained from $100k on 2024-12-24 — not Grok’s $100k book. The two can disagree.

TextUpdates — monthly + in-window weeklies

Three layers: (1) frozen chart triangles = the claim; (2) weeklies = in-window FXwave / discretionary management; (3) Grok = a prompted score of a trade list drawn from (2), not an audit of (1).

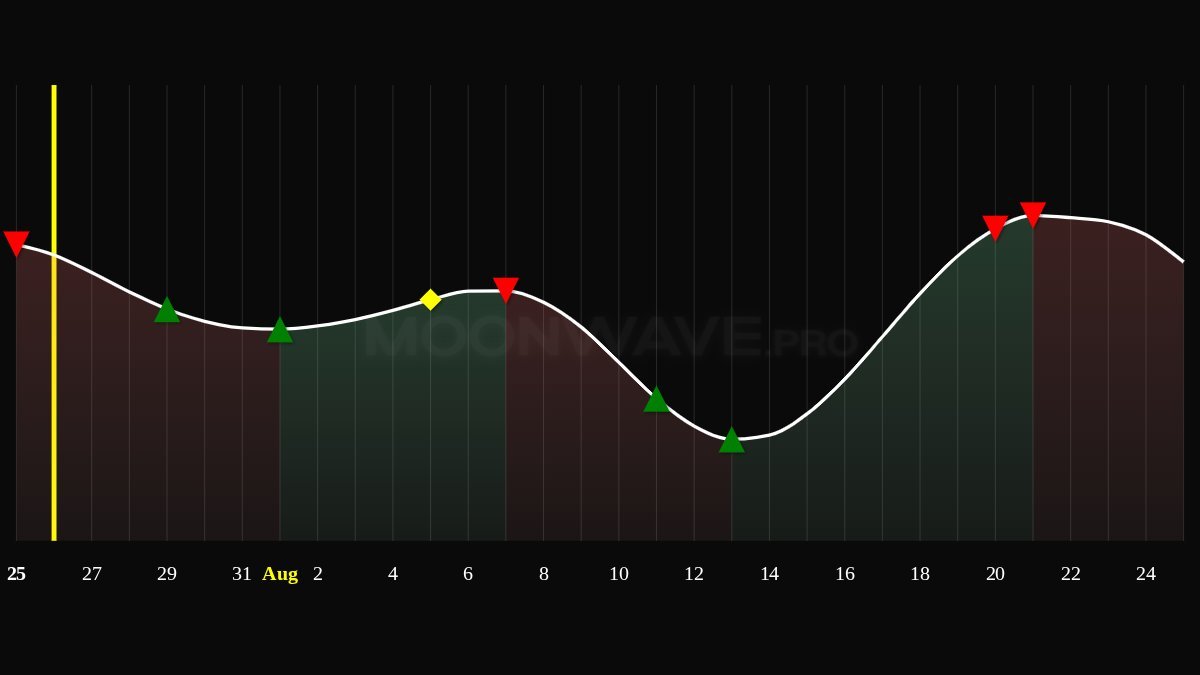
MOONWAVE 4-week forecast chart, 26 Jul–24 Aug 2026. Green ▲ buy: 29 Jul, 1 Aug, 11 Aug, 13 Aug. Red ▼ sell: 25 Jul (open short from prior window), 7 Aug, 20 Aug, 21 Aug. Yellow ◆ volatility/derisk: 5 Aug. Yellow vertical line marks the 26 Jul post date.

Forecast as posted

Monthly Moonwave - July 26, 2026 (1/2) Key dates ahead: Buy: Jul 29 (strengthens Aug 1); Volatility: Aug 5; Sell: Aug 7; Buy: Aug 11-13; Sell: Aug 20-21. After a tough June, July was a return to form. The Jun 29–Jul 1 Buy was a strong entry, the Jul 6-7 Sell delivered the expected pullback, the Jul 8 Volatility marked an early reversal, price dipped into the Jul 13-15 Buy zone, and the confirmed Sell on Jul 23 closed the move cleanly. Strategy + FXwave as confirmation continues to work very well.

Permanent X URL

Grok reply as posted (prompted by @moonwavepro)

Hypothetical Moonwave BTC trader: started $177704. Trades (daily closes, 1x, no SL hit): Short 7/23 65045 → Buy 7/28 63871; Reduce 50% 8/5 64600; Short 8/6 64262 → Buy 8/12 63402; Short 8/23 77755 → Buy 8/27 80258 (open). Marked at ~78200: balance $213360. PNL +$35656 (+20.1%).

Permanent X URL

Hosted chart and quoted text live on this page so the record does not depend on X embeds loading.

4-Week Forecast

July 26–August 23 2026

Role: MOONWAVE 4-week forecast

Author: Moonwave (@moonwavepro)

Posted: 2026-07-26

Permanent URL: https://x.com/moonwavepro/status/2081502035040731204

Post text: Monthly Moonwave - July 26, 2026 (1/2) Key dates ahead: Buy: Jul 29 (strengthens Aug 1); Volatility: Aug 5; Sell: Aug 7; Buy: Aug 11-13; Sell: Aug 20-21. After a tough June, July was a return to form. The Jun 29–Jul 1 Buy was a strong entry, the Jul 6-7 Sell delivered the expected pullback, the Jul 8 Volatility marked an early reversal, price dipped into the Jul 13-15 Buy zone, and the confirmed Sell on Jul 23 closed the move cleanly. Strategy + FXwave as confirmation continues to work very well.

Published calls (chart markers): Buy (green ▲): 2026-07-29, 2026-08-01, 2026-08-11, 2026-08-13. Sell (red ▼): 2026-07-25, 2026-08-07, 2026-08-20, 2026-08-21. Volatility/derisk (yellow ◆): 2026-08-05.

MOONWAVE 4-week forecast chart, 26 Jul–24 Aug 2026. Green ▲ buy: 29 Jul, 1 Aug, 11 Aug, 13 Aug. Red ▼ sell: 25 Jul (open short from prior window), 7 Aug, 20 Aug, 21 Aug. Yellow ◆ volatility/derisk: 5 Aug. Yellow vertical line marks the 26 Jul post date.

Chart image URL (hosted): https://moonwave.pro/forecast-charts/2026-07-26.jpg

Original X media: https://pbs.twimg.com/media/HOL6K_QbIAA1w0v.jpg

Grok Performance Evaluation — August 29, 2026

Grok Performance Evaluation — August 29, 2026

Role: Grok performance evaluation prompted by @moonwavepro (not a third-party audit)

Author: Grok (@grok)

Posted: 2026-08-29

Permanent URL: https://x.com/grok/status/2093800198262649045

P/L as posted: +20.1%. $177,704 → $213,360 (+$35,656). Open buy Aug 27 marked at ~$78,200. 1x, no SL hit.

Post text: Hypothetical Moonwave BTC trader: started $177704. Trades (daily closes, 1x, no SL hit): Short 7/23 65045 → Buy 7/28 63871; Reduce 50% 8/5 64600; Short 8/6 64262 → Buy 8/12 63402; Short 8/23 77755 → Buy 8/27 80258 (open). Marked at ~78200: balance $213360. PNL +$35656 (+20.1%).

August-September 2026 Grok eval pending

Forecast posted August 24, 2026 (X timestamp 24 Aug 00:03 UTC) · Eval pending

Claim — published calls

Buy ▲ Aug 28–30 · Sep 11 (12 possible)
Sell ▼ Sep 2, 16–18
Derisk ◆ Sep 1, 12

Named in the post and marked on the chart. Window still open — no Grok eval yet.

Result — Grok eval pending

Window open — eval pending

Posted 23 Aug 2026. No prompted Grok P&L yet.

Rules-engine P/L — as_simulated (btc-backtest.json)

Window still open. Book at $1,382,377.

1x notional, enter 100% on FXwave confirm, hold on inval, reduce 50% on confirmed vol, 5% SL. Chained from $100k on 2024-12-24 — not Grok’s $100k book. The two can disagree.

TextUpdates — monthly + in-window weeklies

Three layers: (1) frozen chart triangles = the claim; (2) weeklies = in-window FXwave / discretionary management; (3) Grok = a prompted score of a trade list drawn from (2), not an audit of (1).

  • Monthly 2026-08-23 — on site · JSON
  • No in-window weekly posted yet.
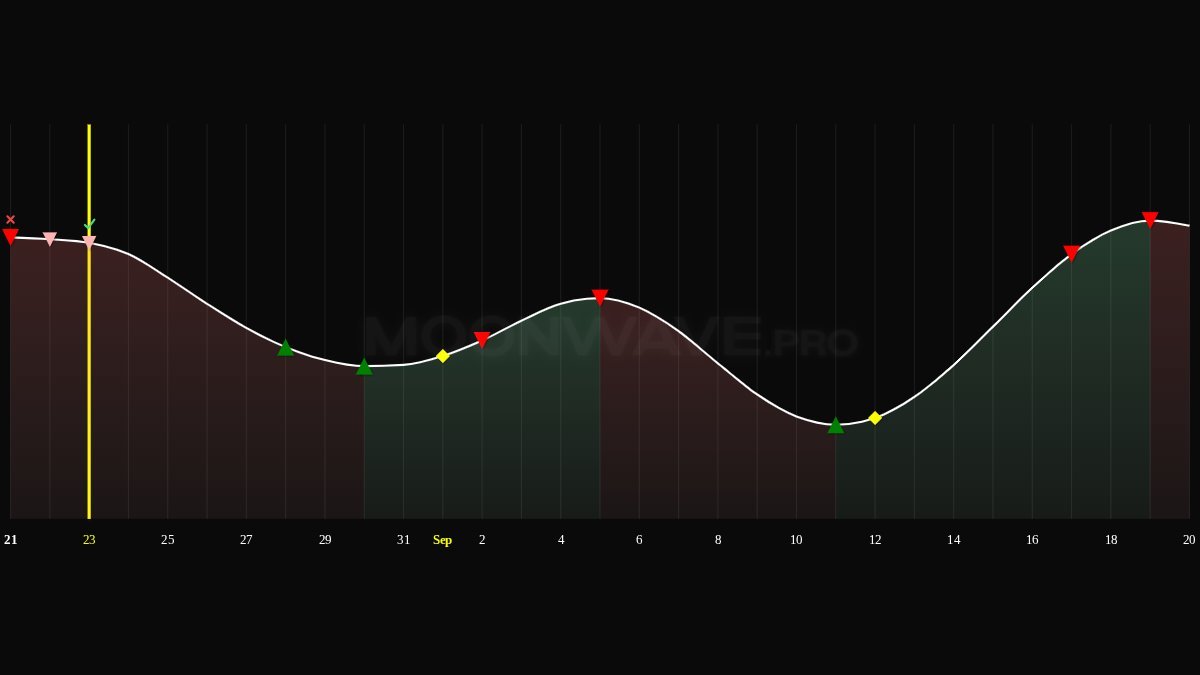
MOONWAVE 4-week forecast chart, 23 Aug–20 Sep 2026. Green ▲ buy: 28 Aug, 30 Aug, 11 Sep. Red ▼ sell: 21–23 Aug (open short / FX-implied), 2 Sep, 5 Sep, 16 Sep, 18 Sep. Yellow ◆ volatility/derisk: 1 Sep, 12 Sep. Yellow vertical line marks the 23 Aug post date.

Forecast as posted

Monthly Moonwave - August-September 2026 (1/2) The model navigated the swings cleanly: short into the end-of-July zone, sold the early-August pullback high, and caught the mid-August buys ahead of the recent advance. The demo strategy entered both buy zones early, missing the exact lows, but the overall sequence tracked well. The demo is currently short, into the Aug 28-30 buy window. The first clear area of elevated risk is the Sep 1 Volatility followed by the Sep 2 Sell. (2/2) Further out, the model shows a high-probability move down into the Sep 11 buy zone (later is better, possibly even the 12th). The Sep 16-17 window coinciding with FOMC carries a risk of a bearish Fed surprise heading into the Sep 18 quadruple witching OPEX.

Permanent X URL

Grok reply as posted (prompted by @moonwavepro)

Posted. Grok evaluation pending.

Hosted chart and quoted text live on this page so the record does not depend on X embeds loading.

4-Week Forecast

August-September 2026

Role: MOONWAVE 4-week forecast

Author: Moonwave (@moonwavepro)

Posted: 2026-08-23

Permanent URL: https://x.com/moonwavepro/status/2091677719310582254

Post text: Monthly Moonwave - August-September 2026 (1/2) The model navigated the swings cleanly: short into the end-of-July zone, sold the early-August pullback high, and caught the mid-August buys ahead of the recent advance. The demo strategy entered both buy zones early, missing the exact lows, but the overall sequence tracked well. The demo is currently short, into the Aug 28-30 buy window. The first clear area of elevated risk is the Sep 1 Volatility followed by the Sep 2 Sell. (2/2) Further out, the model shows a high-probability move down into the Sep 11 buy zone (later is better, possibly even the 12th). The Sep 16-17 window coinciding with FOMC carries a risk of a bearish Fed surprise heading into the Sep 18 quadruple witching OPEX.

Published calls (chart markers): Buy (green ▲): 2026-08-28, 2026-08-30, 2026-09-11, 2026-09-12. Sell (red ▼): 2026-08-21, 2026-08-22, 2026-08-23, 2026-09-02, 2026-09-05, 2026-09-16, 2026-09-18. Volatility/derisk (yellow ◆): 2026-09-01, 2026-09-12.

MOONWAVE 4-week forecast chart, 23 Aug–20 Sep 2026. Green ▲ buy: 28 Aug, 30 Aug, 11 Sep. Red ▼ sell: 21–23 Aug (open short / FX-implied), 2 Sep, 5 Sep, 16 Sep, 18 Sep. Yellow ◆ volatility/derisk: 1 Sep, 12 Sep. Yellow vertical line marks the 23 Aug post date.

Chart image URL (hosted): https://moonwave.pro/forecast-charts/2026-08-23.jpg

Original X media: https://pbs.twimg.com/media/HQchbksaUAAgaFz.jpg

Grok Performance Evaluation — eval pending

Window open — eval pending

Posted 23 Aug 2026. No prompted Grok P&L yet.

Grok Performance Evaluation — pending

Role: Prompted Grok P/L eval has not been posted for this window.

P/L as posted: Window open. Eval pending.

How evaluations work. Each 4-week forecast is timestamped on X. Calls live on the posted Moonwave chart: green triangles (▲) buys, red triangles (▼) sells, yellow diamonds (◆) volatility / derisk. The same date’s TextUpdates monthly (plus nested weeklies) is the written plan. Three layers: (1) frozen chart triangles = the claim; (2) weeklies = in-window FXwave / discretionary management; (3) Grok = a prompted score of a trade list drawn from (2), not an audit of (1).

Two series. Headline boxes are the dashboard rules-engine book (as_simulated on btc-backtest.json) — the same scorer as homepage Historical Performance, not Grok. About four weeks later, @moonwavepro asks Grok to score a posted trade list against historical BTC prices. Those replies are quoted here as posted: public checks, not a third-party audit. Grok equity can restart between periods (April 2026 ~$191k; May restarts from $166,137) and can disagree with the rules-engine row (period 5: Grok −1.13%, sim +21.47%).

Scoring rules — dashboard, and typically the Grok prompt: 1× notional; enter when FXwave confirms the chart signal; hold cash if FXwave invalidates (not automatically a loss); cut 50% on confirmed volatility; 5% stop. They score a window; they are not a promise of future results.

What a hit means. Headline = wins / (wins + losses) on completed trades. A win is a profitable taken trade, a correct stop, or an FXwave invalidation that avoided a losing fill. Volatility-while-cash is excluded. Taken-only is listed separately under the hit rate. Some signal-log rows are thinner or mix field casing; the scorer fills those the same way the dashboard does. This is a rules-engine book, not a brokerage ledger. Snapshot book $100,000 → $1,308,222. Public-era $322,262 → $1,308,222.

Grok equity chain (as posted, not recomputed): $100,000 → $122,229 → $134,273 → $153,836 → $152,100 → $166,137 → ~$191k (April eval, rough) / $166,137 (May restart) → $185,026 → $164,460 → ~$180,369 → $213,360. Period 12: eval pending.

Rules-engine book (as_simulated): chained from $100k on 24 Dec 2024. Public-era slice (19 Oct 2025 onward): computed on load from btc-backtest.json. Windows can overlap, so a period’s start equity is the book on that date, not always the previous period’s end. The source posts are the record.

As of Sep 27 04:08 UTC. Rules-engine snapshot (same scorer as the dashboard, also in forecast-record.json): Strategy Hit Rate 77.6% (104W / 30L of 143 completed; taken-only 73.3%); Strategy P/L +1127.27% vs buy-and-hold −11.03% (24 Dec 2024 → 27 Sep 2026), book $100,000 → $1,227,271; Public Era Hit Rate 79.5% (62W / 16L of 83 completed; taken-only 74.1%); Public Era P/L +280.83% vs buy-and-hold −26.61% since 19 Oct 2025, book $322,262 → $1,227,271. Live boxes update on load from the BTC signal log (through 2026-09-27). This public ledger is BTC-first. Other risk assets may appear on X; they are not in the audited record.

Forecast index — permanent links (machine-readable)
  1. October-November 2025 (posted 2025-10-19) — Forecast @moonwavepro · Grok eval 2025-11-17 · TextUpdate
  2. November-December 2025 (posted 2025-11-17) — Forecast @moonwavepro · Grok eval 2025-12-16 · TextUpdate
  3. December 2025-January 2026 (posted 2025-12-14) — Forecast @moonwavepro · Grok eval 2026-01-15 · TextUpdate
  4. January-February 2026 (posted 2026-01-11) — Forecast @moonwavepro · Grok eval 2026-02-08 · TextUpdate
  5. February-March 2026 (posted 2026-02-08) — Forecast @moonwavepro · Grok eval 2026-03-08 · TextUpdate
  6. March-April 2026 (posted 2026-03-08) — Forecast @moonwavepro · Grok eval 2026-04-09 · TextUpdate
  7. April-May 2026 (posted 2026-04-05) — Forecast @moonwavepro · Grok eval 2026-05-03 · TextUpdate
  8. May-June 2026 (posted 2026-05-03) — Forecast @moonwavepro · Grok eval 2026-06-02 · TextUpdate
  9. June-July 2026 (posted 2026-05-31) — Forecast @moonwavepro · Grok eval 2026-06-28 · TextUpdate
  10. July-August 2026 (posted 2026-06-28) — Forecast @moonwavepro · Grok eval 2026-07-26 · TextUpdate
  11. July 26–August 23 2026 (posted 2026-07-26) — Forecast @moonwavepro · Grok eval 2026-08-29 · TextUpdate
  12. August-September 2026 (posted 2026-08-24) — Forecast @moonwavepro · Grok eval pending · TextUpdate

One row per period: forecast-record.json · Full signal log: btc-backtest.json · TextUpdates: index.json

Forecast record — forecast-record.json one row per period Full signal log — btc-backtest.json machine-readable TextUpdates index monthly + weekly JSON

All signals and analysis are provided for educational and informational purposes only. Not financial advice. Past performance does not guarantee future results. Trading involves substantial risk of loss. Grok evaluations are prompted by @moonwavepro. They are public checks, not third-party audits. The public ledger is BTC-first.